Assessment of the impact of body fatness on functional performance in early stages of rehabilitation after knee replacement
- *Corresponding Author:
- Dr. Katarzyna Ogrodzka
Department of Clinical Rehabilitation, Faculty of Motor Rehabilitation, University of Physical Education in Kraków, Poland Al. Jana Pawla II 78 31-571 Krakow, Poland
Ph: +48 12 683 10 65
E-mail: katarzynaogrodzka@wp.pl
Received Date: 14.03.2017 Accepted Date: 21.04.2017 Published Date: 24.04.2017
Abstract
Introduction: Obesity is generally considered a chronic metabolic disease which is characterised by excessive accretion of adipose tissue. This pathology of fat accretion may lead to creation of pathological units, including gonarthrosis. The aim of the study was to evaluate the impact of body weight on functional performance in early stages of rehabilitation after knee replacement. Material and methods: The research material comprised 35 patients. The Group included 26 women and 9 men who suffer from advanced degenerative changes of knee joint and qualified for the knee replacement. The patients were assigned to one out of three Groups depending on body mass index. To assess the functional status the following tools were used: the VAS scale, 100-point Lysholm-Gillquist scale, the TUG test, and the measurement of the range of joint mobility. Results: Statistically significant results were achieved by first and second Group in joints mobility measurement. All the Groups revealed statistically meaningful differences in pain measurement with the use of VAS scale and 100-point Lysholm-Gillquist scale. Only third Group proved statistically meaningful outcomes while TUG test was used in the assessment. Conclusion: High body mass index does not have a negative impact on the re-establishment of functional ability after knee replacement. In the assessment of selected parameters (ROM, TUG), people who had BMI >35,00 kg/ m2 got better results than people who had lower BMI.
Keywords
Knee replacement, obesity, body mass index
Introduction
Obesity is considered as a chronic metabolic disease that is characterized by excessive accretion of adipose tissue. It is caused by a variety of individual and environmental factors, but the main cause is considered to be an imbalance between the energy acquired with food and its expenditure. [1]
In a population of people over 60 years of age changes in the physiology, physical activity and the accompanying diseases are responsible for the development of excessive body weight, leading to overweight and obesity in this age group. Causing impairment of psychophysical fitness and limitation of the independency of the elderly, thus contributing to a reduced quality of their lives. [2] Obesity predisposes also to diseases such as diabetes, hypertension and diseases of the osteoarticular system, including gonarthritis [3].
Progressive osteoarthritis of the knee (gonarthritis) with increasing pain, deformities and limitation of mobility is the main cause of knee replacement. Significant correlation between obesity and the speed of development of gonarthisis causes that among many people qualified for the surgery BMI exceeds the appropriate value.
Currently most of the patients who decide to have knee replacement surgery are in the overweight group. One third of patients are obese, half of whom have obesity grade III. At such a large scale, weight should be considered as a factor that may affect the return to postoperative physical fitness [3-5].
Available scientific papers showing the relationship between the results achieved after knee replacement and obesity are ambiguous. In contrast, it is important to determine the level of BMI, at which a visible change in functional indicators after surgery can be determined. Most researchers have a BMI of 30 kg/ m2 as a benchmark. Current scientific studies assess the functional status of patients after knee arthroplasty based on objective measurement methods. Muscle strength, joint mobility, pain and mobility with standardized scales are assessed. In addition, the subjective perception of the patient after the treatment is evaluated. Depending on the purpose of the study, comparisons are made between groups of patients with normal body mass and obese patients. Literature review does not make it clear whether obesity is a factor that significantly affects the patient’s functional efficiency directly after the knee replacement surgery. Currently, the number of studies showing a negative impact and no differences in the above and below 30 kg/m2 groups is comparable [5-8].
The aim of the study was to assess the effect of body mass on the functional performance of patients in early stages of rehabilitation after total knee replacement.
Material and Methods
40 patients were qualified for the research Once all the criteria for inclusion in the study had been met, the research Group comprised 35 patients (9 men and 26 women), with advanced degenerative changes qualified for knee replacement by an orthopaedist.
Eligibility criteria were:
- Qualification for knee arthroplasty due to diagnosed joint osteoarthritis.
-Ability to move independently before and after the surgery (without the aid of orthopaedic supports).
-Lack of injuries or diseases that would prevent the examination (e.g. acute injuries of the ligaments/meniscus, osteoarthritis of the hip).
- A voluntary consent of the patient to participate in the study.
- The patient did not take any medicines affecting coordination.
Exclusion criteria:
- Post-operative complications (general and local).
- Verbal-logical contact disruption.
- Intraoperative decision to implant a knee endoprothesis other than the total one.
The research was conducted at orthopaedic wards of hospitals in Kraków, between January and May 2015. Each patient was assessed twice, the day before the scheduled surgery and 1.5 months after it
Based on BMI each patient was assigned to one of three Groups. To Group 1 were allocated 16 patients, the average age in the Group was 69.4 ± 6.3, BMI was <30 kg/m2. Group 2 consisted of 10 patients whose average age was 70.1 ± 10.8 and BMI was 30- 34.99 kg/m2. In Group 3, there were 9 patients with an average age of 67.7 ± 5.9 and BMI within the range of >35 kg/m2. A detailed characteristic of the patients is shown in Table 1.
| Variable | Group 1 | Group 2 | Group 3 |
|---|---|---|---|
| BMI<30.00 kg/m2 | BMI 30.00-34.99 kg/m2 | BMI > 35.00 kg/m2 | |
| X ± SD | |||
| Age [yrs] | 69.40 ± 6.30 | 70.10 ± 10.80 | 67.70 ± 5.90 |
| Body Mass [kg] |
74.40 ± 8.20 | 92.50 ± 9.30 | 96.70 ± 8.70 |
| Body height [cm] |
166.40 ± 7.90 | 167.90 ± 6.30 | 159.30 ± 7.30 |
Table 1. Anthropometric data of the research group.
The presented studies involved an assessment of the functional status of patients with the use of a 10-grade visual-analog scale (VAS) – evaluating pain level, the Timed Up and Go test (TUG) – enabling to measure the time it takes to walk a 3- meter distance, Lysholm scale – evaluating knee discomfort in a subjective way and the measurement of the range of knee flexion and extension– by means of a goniometer (error reading up to 5o) [9-11].
For statistical analysis Statistica 10 software was used. Mean (x) and standard deviation (SD) of the variables were calculated for all patients.
Statistical analyzes were carried out using PQStat statistical package version 1.6.2.901. The results of the analyzed scales were compared with a two-way analysis of variance with repeated measurements (ANOVA). The probability of p < 0.05 was considered significant and the probability of p < 0.01 was considered to be highly significant.
Results
Measurement of the Knee Flexion
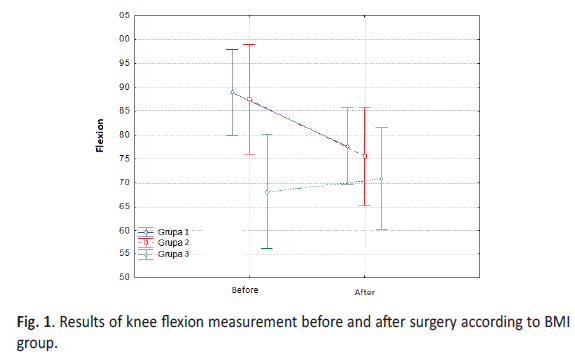
The first assessed values in the research Groups were the results of measurements of the range of knee flexion, made before and after the surgery (Table 2a).
| Group | Before | After | ||
|---|---|---|---|---|
| x | SD | x | SD | |
| 1 | 88.88 | 16.06 | 77.63 | 16.62 |
| 2 | 87.50 | 19.54 | 75.50 | 18.17 |
| 3 | 68.11 | 18.74 | 70.89 | 9.90 |
Table 2a. Knee flexion before and after knee replacement in research groups.
The analysis showed no statistically significant differences between measurements of the range of knee flexion prior to and after the procedure, depending on the BMI Group. There is, however, a slight tendency towards this direction (F = 2.69; p = 0.08). This means that the change in the level of flexion differed depending on the level of obesity. Statistically significant differences (p < 0.05) was obtained in the knee flexion measurement within the study group, depending on the timing of the measurement. There was a reduction knee flexion after surgery (Table 2b).Before vs. after – measurement before and after knee replacement.
| F | p | |
|---|---|---|
| Group | 2.67 | 0.08 |
| Term | 6.00 | 0.02 |
| Interaction | 2.69 | 0.08 |
Table 2b. Analysis of the interaction between the knee flexion measurement before and after knee replacement, depending on the obesity level.
The analyses revealed that in the Group with the lowest and average obesity knee flexion decreased statistically significantly, whereas the difference in measurements taken before and after in the Group with the highest obesity did not reach the level of statistical significance. The analyses showed that the change in flexion in Group 1 was not statistically significantly different from the change in Group 2, that is to say, in both Groups joint flexion decreased to a similar extent. The level of change in flexion in Group 1 differed significantly from the level in Group 3, whereas in Group 2 this difference was at the limit of significance. This means that in the Group with the highest obesity the change in the range of joint flexion was different than in other two Groups and the flexion in the second measurement was slightly higher than in the first one (Figure. 1).
Measurement of the Knee Extension
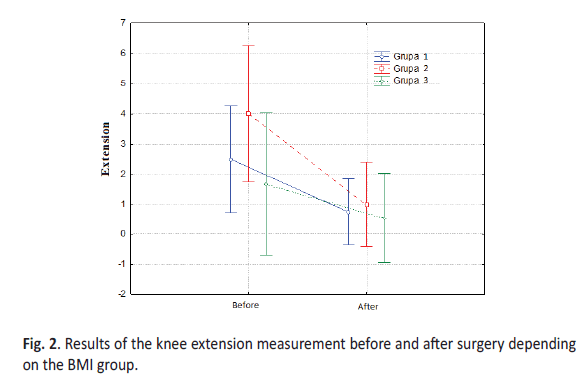
Another values in the research Groups were the results of knee extension measurements taken before and after the surgery (Table 3a).
| Group | Before | After | ||
|---|---|---|---|---|
| x | SD | x | SD | |
| 1 | 2.50 | 3.16 | 0.75 | 1.65 |
| 2 | 4.00 | 4.59 | 1.00 | 3.16 |
| 3 | 1.67 | 2.50 | 0.56 | 1.67 |
Table 3a. Knee extension before and after knee replacement in research groups.
The analysis revealed no statistically significant differences between measurements of the range of knee extension before and after the surgery depending on the BMI Group. However, a tendency towards this direction can be observed (F = 1.20; p = 0.31). This means that the change in the level of extension was different depending on the level of obesity. Highly statistically significant differences (p<0.01) were obtained in the measurement of the knee extension in the whole examined Group, depending on the timing of the measurement. There was an increase in the range of knee extension after the surgery (Table 3b).
| F | p | |
|---|---|---|
| Group | 0.72 | 0.05 |
| Term | 16.75 | 0.00 |
| Interaction | 1.20 | 0.31 |
Table 3b. Analysis of the interaction between the knee extension measurements before and after knee replacement depending on the obesity level.
The analyses disclosed that in the Group 2 knee extension decreased statistically significantly, while the difference in measurements taken prior to and after the surgery in the Group 1 and 3 did not reach the level of statistical significance. The analyses showed that the difference in the level of changes in extension between particular Groups did not reach the level of statistical significance. This means that in all BMI Groups the level of extension decreased in a similar way (Figure. 2).
Results of the VAS scale
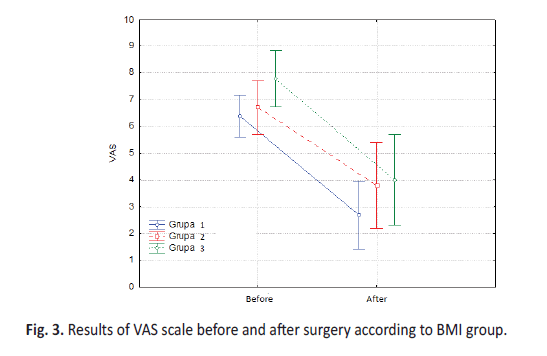
In all Groups there was a decrease in the results of the VAS scale after surgery, the largest level of this change concerned Group 3 (Table 4a).
| Group | Before | After | ||
|---|---|---|---|---|
| x | SD | x | SD | |
| 1 | 6.38 | 1.15 | 2.69 | 2.18 |
| 2 | 6.70 | 2.06 | 3.80 | 2.82 |
| 3 | 7.78 | 1.56 | 4.00 | 2.65 |
Table 4a. VAS scale results before and after knee replacement in research groups.
The analysis revealed no statistically significant difference between the results of the VAS scale before and after the surgery depending on the BMI Group (F = 0.58, p = 0.57). Highly statistically significant differences (p <0.01) in the pain level in the study group were recorded, depending on the timing of the treatment. The pain level was reduced after the surgery (Table 4b).
| F | p | |
|---|---|---|
| Group | 1.68 | 0.20 |
| Term | 93.85 | <0.0001 |
| Interaction | 0.58 | 0.57 |
Table 4b. Analysis of the interaction between the VAS scale measurements before and after knee replacement, depending on the obesity level.
The analyses showed that in each BMI Group the level of VAS decreased statistically significantly. The analyses indicated that the difference in the level of changes in the VAS scale between the Groups did not reach the level of statistical significance. This means that this change was similar in all Groups (Figure 3).
Results of the Lysholm Scale
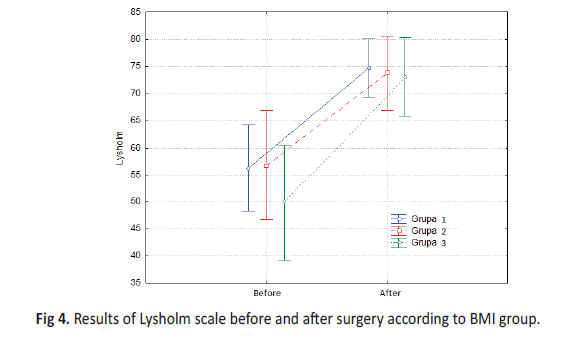
The analysis of the Lysholm scale results showed that the greatest performance after the surgery based on the score was recorded in Group 1. The largest level of change in score before and after surgery was noted in Group 3 (Table 5a).
| Group | Before | After | ||
|---|---|---|---|---|
| x | SD | x | SD | |
| 1 | 56.31 | 17.58 | 74.75 | 12.12 |
| 2 | 56.80 | 11.48 | 73.80 | 7.95 |
| 3 | 49.89 | 16.17 | 73.11 | 10.14 |
Table 5a. Lysholm scale results before and after knee replacement in research groups.
The analysis did not show any statistically significant differences between the results of the Lysholm scale obtained before and after the surgery depending on the BMI Group (F = 0.36, p = 0.70). Highly statistically significant differences (p <0.01) in Lysholm scales were found throughout the study group, depending on the timing of the measurement. The scores were definitely higher after surgery (Table 5b).
| F | p | |
|---|---|---|
| Group | 0.48 | 0.63 |
| Term | 44.57 | <0.0001 |
| Interaction | 0.36 | 0.70 |
Table 5b. Analysis of the interaction between the Lysholm scale measurement before and after knee replacement, depending on the obesity level
The statistical analysis showed that the difference in the level of change in knee function measurement taken with the Lysholm scale in the Groups did not reach the level of statistical significance. This means that this change was similar in all Groups. The analyses revealed that in Group 1 and 3 the level of knee function measurement conducted by means of the Lysholm scale increased statistically significantly (Figure. 4).
Results of the Tug Test
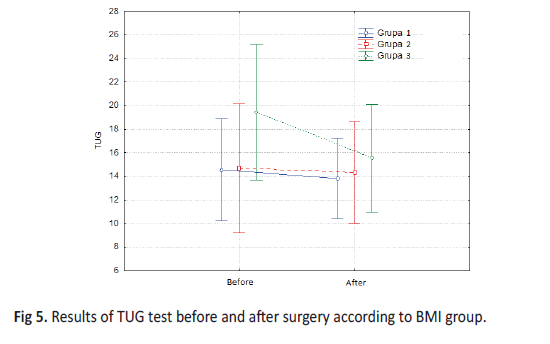
On the basis of the analysis of the arithmetic mean (x), in all Groups was noted a reduction in the time required to perform the TUG test after surgery, while the largest degree of this change concerned Group 3 (Table 6a.).
| Group | Before | After | ||
|---|---|---|---|---|
| x | SD | x | SD | |
| 1 | 14.56 | 8.23 | 13.81 | 6.16 |
| 2 | 14.70 | 7.39 | 14.30 | 7.76 |
| 3 | 19.44 | 9.98 | 15.56 | 6.54 |
Table 6a. TUG test results before and after knee replacement in research groups.
The analysis showed no statistically significant difference between the results of the TUG test before and after the surgery depending on the BMI Group (F = 1.95, p = 0.16). Significant differences (p <0.05) in TUG test measurement across the study group were obtained, depending on the timing of the measurement. After the surgery, the time needed to complete the test was reduced (Table 6b).
| F | p | |
|---|---|---|
| Group | 0.64 | 0.54 |
| Term | 5.00 | 0.03 |
| Interaction | 1.95 | 0.16 |
Table 6b. Analysis of the interaction between the TUG test measurement before and after knee replacement, depending on the obesity level
The analyses showed that the difference in the level of change in the TUG test between the Groups did not reach the level of statistical significance. However, in the case of comparisons of Group 3 there is a clear tendency to a bigger change in the outcome of the TUG test than in Groups 1 and 2. This means that the decrease in the value of the TUG test was most visible in Group 3 and the lack of significance of these differences is probably related to a small size of Group 3 (Figure. 5).
Discussion
According to current standards adopted by the WHO, obesity applies to people whose BMI is ≥30 kg/m2. Authors of numerous papers draw attention to the relationship between obesity and the development of knee osteoarthritis, where there is an increased axial load on the joint, consequently leading to its damage. Such changes are treated by joint arthroplasty. [12,13]
Some researchers emphasize the need to inform obese patients of the possibility of obtaining worse results after surgery compared to people with normal level of adiposity [12-14]. In their studies, Stevens-Lapsley et al. highlight the opinion of orthopaedists who have a similar attitude [15-18]. Lui et al. and Naylor et al. refer to specific actions undertaken by doctors that influence the formation of correct eating habits in patients eligible for knee arthroplasty [12,15]. Specialists in orthopaedics encourage weight reduction already at the stage of qualifying for surgery. This issue is extremely important and addressed in scientific reports.
Own research confirms the need to inform obese patients about the consequences this disease may have after the surgery. Patients who already on the first visit had been informed by an orthopaedic about a number of complications associated with obesity, decided to reduce body weight.
In the available literature there is a large disparity in results concerning the effects of knee arthroplasty in obese people.
Zeni et al. obtained significantly better results of the TUG test among obese patients than in those with normal weight [16]. Dere et al. reached similar conclusions. In addition, they emphasized the lack of correlation between BMI and the results of knee replacement in terms of perceived pain and physical performance [17]. In their studies, Stevens-Lapsley et al. highlight the lack of relationship between weight and the assessment of functional capacity/ performance and at the same time indicate that BMI should not be the sole determinant of predicted effects of the treatment [18].
Analyzing the results of the VAS scale in own research, it can be concluded that in all BMI Groups a similar level of changes in results was achieved, in each Group the pain decreased significantly. The assessment of the TUG test in own research showed that only in the Group with the highest obesity there was a significant decrease in the TUG measurement and the change was greater than in the Groups with lower and average obesity
Bin Abd Razak et al. conducted research on a Group of 369 patients who had undergone knee arthroplasty. The results of studies concerning the range of movement in the research Group clearly shows that people with BMI > 35 kg/m2 achieved statistically better results than those with a lower BMI. [19].
Own research indicate that only in Group 2 (BMI 30.00 – 34.99 kg/m2) one can speak of a significant change in knee flexion before and after the surgery. The analysis of the range of extension showed that in all three BMI Groups extension declined in a similar manner, but only in Group 2 (BMI 30.00 – 34.99 kg/m2) the change reached the level of statistical significance. Such a result may be caused by the smallest size of the Group.
Dere et al. showed no negative impact of obesity on the speed of regaining functional fitness after surgery [17]. Rastogi et al. provided the research in which obese people achieved an improvement in functional status within 4 weeks after the treatment [20].
The analysis of the Lysholm scale results in own studies showed that in all BMI Groups the measurement increased significantly.
Now-a-days, when overweight and obesity are global civilization diseases, body mass must be taken into account during processes associated with both preparing a patient for knee arthroplasty and the rehabilitation afterwards. Body mass index (BMI) is itself a tool that allows determining the degree of obesity. It is not, however, perfect, as it does not take into account the degree of training of the body or fluctuations in the proportions of adipose, muscle and bone tissue that depend on the body. Therefore, it should only be of indicative and statistical nature [3].
Conclusions
High body mass index has no negative impact on regaining one’s functional performance after knee arthroplasty.
In the assessment of the selected indicators (ROM, TUG) patients with BMI > 35 kg/m2 obtained better results than those with a lower BMI.
References
- Perry C., Keane E., Layte R I WSP.: The use of a dietary quality score as a predictor of childhood overweight and obesity. BMC Public Health. 2015 24: 581-590.
- Alska E., Sysakiewicz M, Buda K I WSP.: Obesity among elderly peoplemeasures, causes. Nutrition guidelines for the elderly. J Health Sci, 2014; 4(16): 144-154.
- Oberbek J., Synder M.: Impact of Body Mass Index (BMI) on early outcomes of total knee arthroplasty. Ortopedia Traumatologia Rehabilitacja. 2015; 2(6): 127-134.
- Rojek A., Snela S., Jaźwa P.: Influence of obesity on the outcome of total knee replacement for osteoarthritis. Medical Review of the University of Rzeszow and the National Institute of Drugs in Warszawa. 2010; 3: 271-276.
- Liljensøe A., Lauersen J. O., Søballe K I WSP.: Overweight preoperatively impairs clinical outcome after knee arthroplasty: A cohort study of 197 patients 3–5 years after surgery. Acta Orthop. 2013; 84(4): 392-397.
- Baker P., Muthumayandi K., Gerrand C I WSP.: Influence of body mass index (BMI) on functional improvements at 3 years following total knee replacement: a retrospective cohort study. PLoS One. 2013; 8(3): e59079.
- Kahn T., Soheili A., Schwarzkopf R.: Outcomes of total knee arthroplasty in relation to preoperative patient-reported and radiographic measures. Geriatr Orthop Surg Rehabil. 2013; 4(4): 117-126.
- Edwards C., Rogers A., Lynch S I WSP.: The effects of bariatric surgery weight loss on knee pain in patients with osteoarthritis of the knee. Arthritis. 2012; 504189: 1-7.
- Bengtsson J., Mollborg J., Werner S.: A study for testing the sensitivity and reliability of the Lysholm knee scoring scale. Knee Surg Sports Traumatol Arthrosc. 1996; 4(1): 27-31.
- Wewers ME., Lowe NK.: A critical review of visual analogue scales in the measurement of clinical phenomena. Res Nurs Health. 1990; 13(4): 227-236.
- Pieniążek M.: Selected issues of kinesitherapy. Scripting Publisher – University of Physical Education im. Bronisław Czech in Cracow; 1988.
- Lui M., Jones CA., Westby MD.: Effect of non-surgical, non-pharmacological weight loss interventions in patients who are obese prior to hip and knee arthroplasty surgery: a rapid review. Syst Rev. 2015; 27:4: 121-129.
- Kerkhoffs G.M., Servien E., Dunn W I WSP.: The influence of obesity on the complication rate and outcome of total knee arthroplasty: A meta-analysis and systematic literature review. J Bone Joint Surg Am. 2012; 94(20): 1839- 1844.
- Singh J.A., Gabriel S.E., Lewallen D.G.: Higher body mass index is not associated with worse pain outcomes after primary or revision total knee arthroplasty. J Arthroplasty. 2011; 26(3): 366-374.
- Harmer A.R., Heard RC.: Severe other joint disease and obesity independently influence recovery after joint replacement surgery: an observational study. Aust J Physiother. 2008; 54(1): 57-64.
- Zeni J.A., Snyder-Mackler L.: Early postoperative measures predict 1- and 2-year outcomes after unilateral total knee arthroplasty: importance of contralateral limb strength. Phys Ther. 2010; 90: 43-54.
- Dere D., Paker N., Soy Buğdayci D I WSP.: Effect of body mass index on functional recovery after total knee arthroplasty in ambulatory overweight or obese women with osteoarthritis. Acta Orthop Traumatol Turc. 2014; 48(2): 117-121.
- Stevens-Lapsley J.E., Petterson S.C., Mizner RL I WSP.: Impact of body mass index on functional performance after total knee arthroplasty. J Arthroplasty. 2010; 25(7): 1104-1109.
- Bin Abd Razak H.R., Chong H.C., Tan AH.: Obesity does not imply poor outcomes in Asians after total knee arthroplasty. Clin Orthop Relat Res. 2013; 471(6): 1957-1963.
- Rastogi R., Chesworth B.M., Davis AM.: Change in patient concerns following total knee arthroplasty described with the International Classification of Functioning, Disability and Health: a repeated measures design. Health Qual Life Outcomes. 2008; 6: 112-119.

 Journal of Orthopaedics Trauma Surgery and Related Research a publication of Polish Society, is a peer-reviewed online journal with quaterly print on demand compilation of issues published.